Skip to content Skip to footer
Zabbix_logo

Monitor your entire IT infrastructure without interruptions
Request a free Zabbix demo with our certified team.
We are an official Zabbix partner in Argentina, offering local technical support and customized consulting services for businesses.

They rely on Zabbix for their monitoring

Item 1
Item 2
Item 3
Item 4
Item 6
Item 7
Item 8
Item 9
Zabbix Partner

Official partner in Argentina

1749235380144
Zabbix Argentina

Local support and
certified consulting

We are an official Zabbix partner in Argentina, providing consulting, technical support, and IT monitoring solutions to companies across the country. If you're looking for Zabbix experts in Argentina, CTL has the team you need.

Implementation of Zabbix

We design and implement Zabbix based on each organization’s infrastructure and operational goals, ensuring that monitoring is aligned with business needs.

Zabbix Support in Argentina

We provide local technical support in Spanish during regional business hours, ensuring a prompt response to incidents and operational requests.

Optimization and continuous operation

We optimize metrics, alerts, and dashboards to improve visibility, reduce unnecessary alerts, and shorten resolution times.

IT Monitoring with Zabbix from the Inside:
: Myths, Alerts, and Key Decisions

Our Solutions

Technology that drives the growth of your business

We design solutions tailored to every need, integrating industry-leading tools and innovative practices to ensure performance, visibility, and operational efficiency.

Comprehensive Monitoring

Monitor any stack, application, or infrastructure, at any scale and anywhere.

Proactive Support

We promptly resolve any critical issues detected or reported through our channels.

Full Implementation

We help you set up your monitoring environment from scratch: assessment, deployment, and full implementation.

Immigration & Integration

Migrate from Nagios, PRTG, or other systems, and seamlessly integrate databases, ITSMs, servers, VoIP, and more.

Integrations that enhance
your monitoring

Zabbix monitoring

Everything you can monitor with Zabbix

Critical infrastructure, networks, applications, and services. Real-time visibility, actionable alerts, and operations without guesswork.

Hosts
0
Items
0
Triggers
0
Status
OK Warning Critical

IT Infrastructure

CPURAMDiskProcesses
Servers & Operating Systems
  • Linux / Windows
  • Critical services and processes
  • Capacity and utilization
Hardware
  • Sensors (temperature, fans, PSU)
  • RAID / SMART
  • Component Status
Availability
Uptime99.95%
Latency↗
Capacity78%

Networks and Connectivity

BandwidthLossLatencyInterfaces
Teams
  • Switches / routers
  • Firewalls
  • Press releases and links
Network quality
  • Jitter / loss
  • RTT and degradation
  • Threshold Alerts
Traffic
Inbound72% peak
Outbound49% normal

Apps and Services

HTTP/SAPIsDBLogs
Availability
  • Websites and endpoints
  • Synthetic checks
  • Offices
Performance
  • Response times
  • Errors / codes
  • Capacity and utilization
Key indicators
200OK replies
5xxErrors
TimeoutCritical

Cloud and virtualized environments

AWSAzureGCPVMware
Virtualization
  • VMware / Hyper-V / Proxmox
  • Hosts and VMs
  • Resources and capacity
Cloud
  • Services and metrics
  • Consumption alerts
  • Regional availability
Scalability

Distributed monitoring, proxies, templates, and automation to help you grow without losing control.

Business Services

SLASLOAvailabilityImpact
SLA & Reports
  • Availability by service
  • Trends and capacity
  • Management reports
Floor Plan
  • What falls when X falls?
  • Alert correlation
  • Prioritization by impact
Actionable alerts

Less noise, more signal: clear rules, escalation, and rapid response.

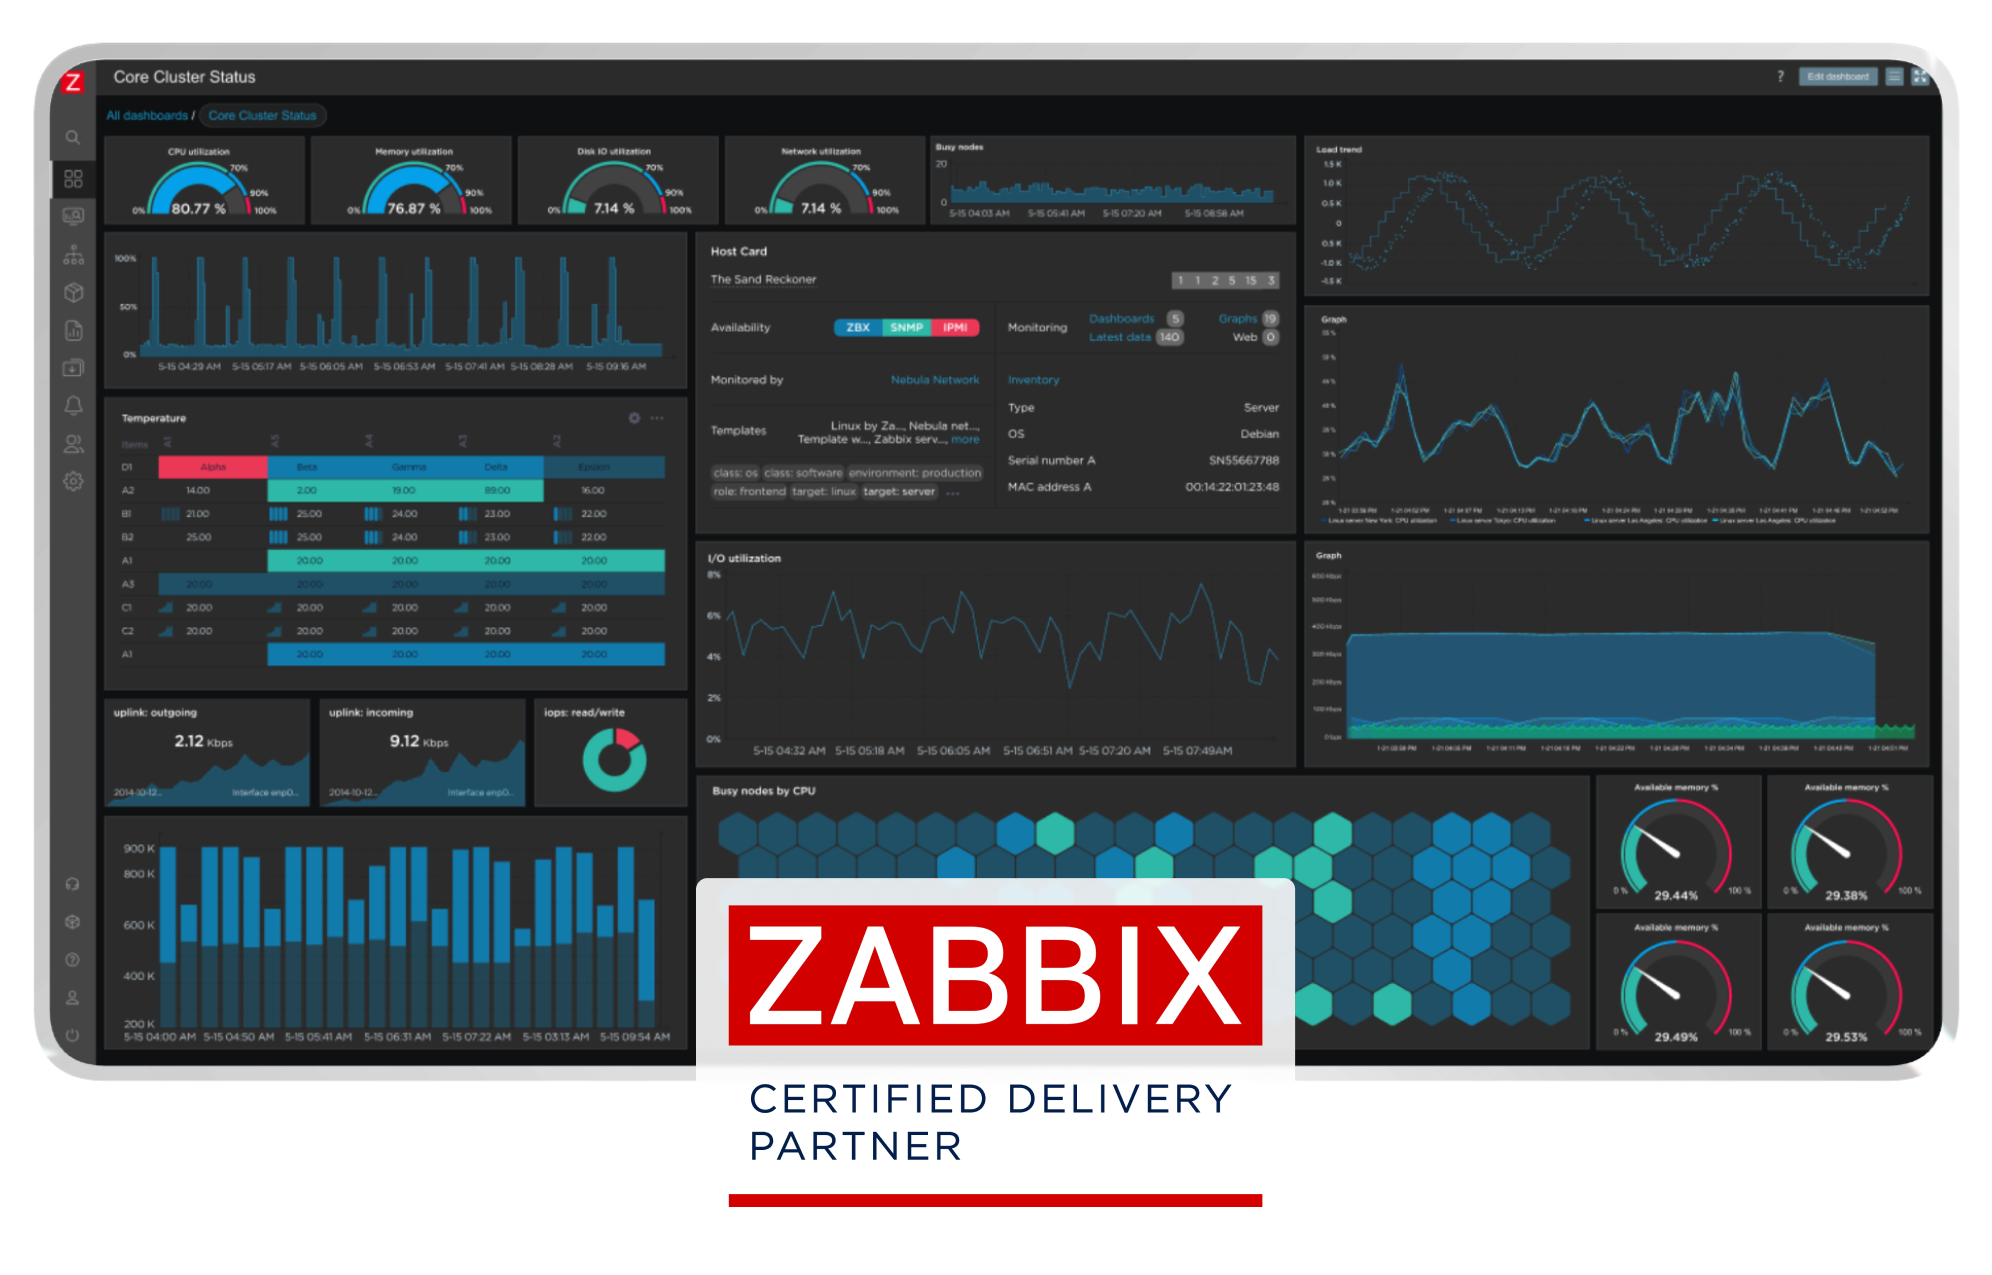
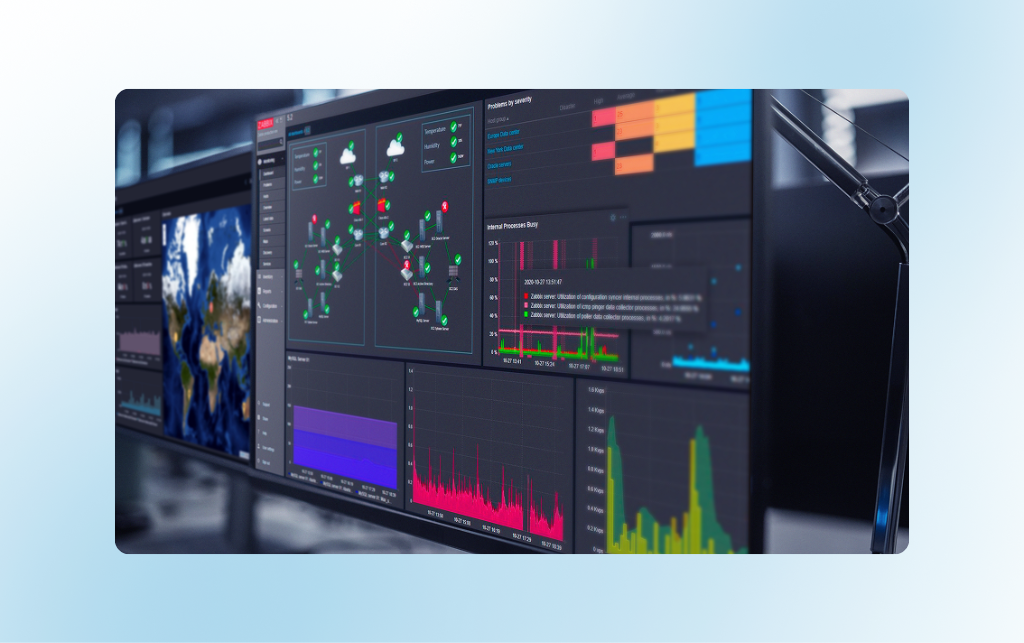
Illustrative mockup created using fictitious data. It does not represent actual customer information, production environments, or active configurations.

Your infrastructure, optimized: that's our approach with
Zabbix

A single system

All your infrastructure

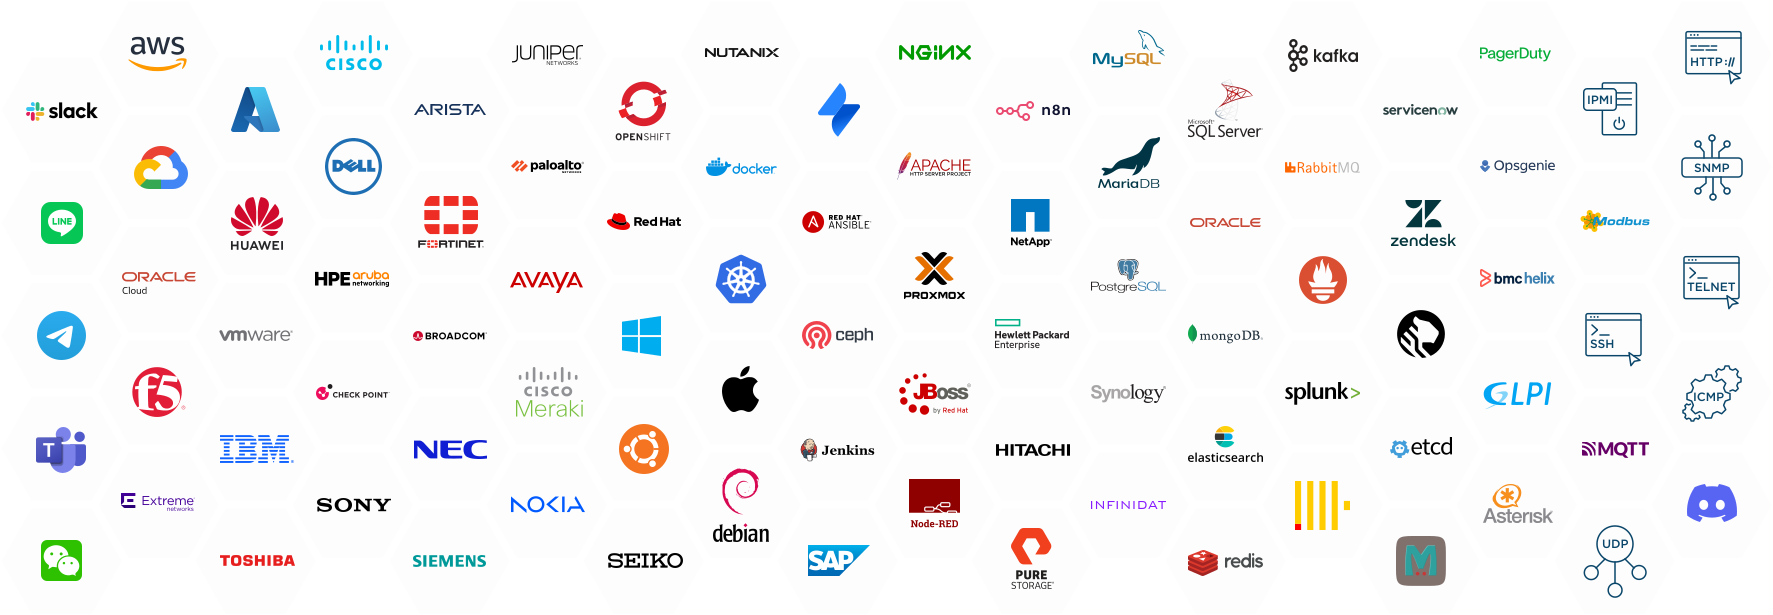
Zabbix combines monitoring, alerts, visualization, and support into a single, license-free platform. What you see on the right is just a fraction of everything you can integrate in real time.

24/7 real-time monitoring

Monitor any stack, application, or infrastructure, at any scale and anywhere.

Automatic and personalized alerts

Monitor any stack, application, or infrastructure, at any scale and anywhere.

Integration with AWS, Azure, VMware, and more

Monitor any stack, application, or infrastructure, at any scale and anywhere.

Customizable dashboards and reports

Monitor any stack, application, or infrastructure, at any scale and anywhere.

Unlimited scalability

Monitor any stack, application, or infrastructure, at any scale and anywhere.
A unified observability platform

The open-source open-source observability platform for IT and OT

Zabbix allows you to collect metrics, generate alerts, and view data in real time from a single observability platform that can be adapted to on-premises, cloud, and hybrid environments, with no per-device or per-metric fees.

Scalability for complex environments

Zabbix is designed to operate in environments ranging from small-scale infrastructures to enterprise-level setups with thousands of monitored nodes.

Wide range of technological compatibility

It supports servers, networks, databases, applications, containers, and cloud services without the need for additional tools.

Automation and proactive detection

It automatically detects issues and takes action in response to critical events, reducing response times.

Open-source model with no licensing dependencies

Full access to the platform with no per-device or per-metric fees, avoiding vendor lock-in and making it easier to manage your budget.
IT Monitoring Solutions with Zabbix

Visibility, control, and incident prevention in critical environments

01

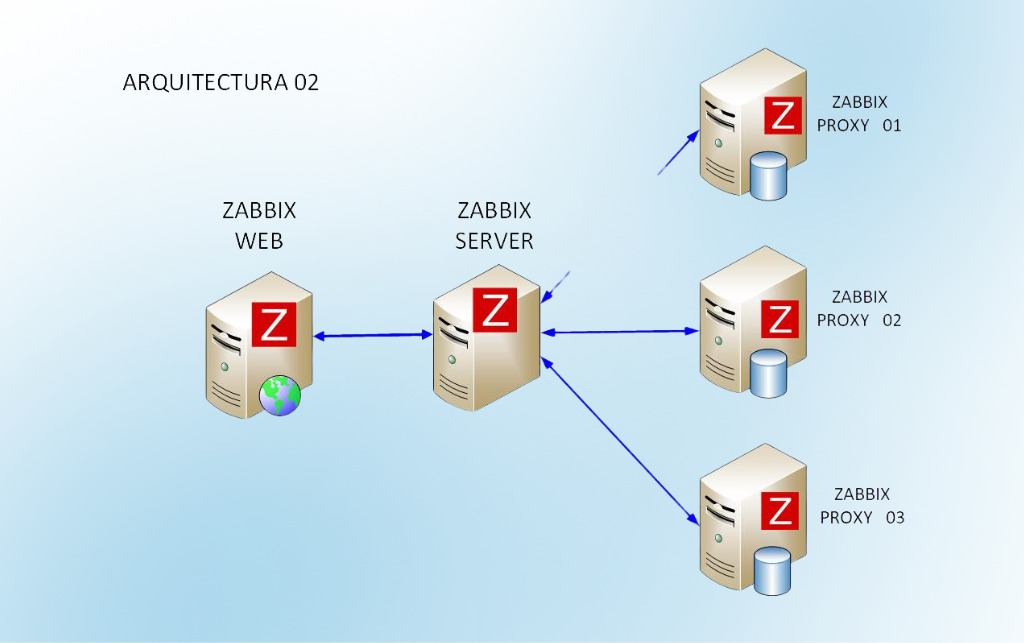
Monitoring Architecture Design

Defining the Zabbix architecture based on each organization's infrastructure, critical services, and operational objectives.

02

Configuring Metrics and Alerts

Implementation of relevant metrics, smart thresholds, and actionable alerts to detect incidents before they impact the business.

03

Analysis, optimization, and continuous improvement

Regular review of metrics, alerts, and dashboards to improve visibility, reduce operational noise, and support the growth of the IT environment.

1
1

We are Zabbix Partner

IT Infrastructure Management and Observability

Incident Prevention and IT Operations Management

Zabbix is an enterprise-class monitoring platform that enables real-time monitoring of the status of critical infrastructure, services, and applications. A proper implementation does more than just display metrics: it helps anticipate failures, reduce response times, and improve operational continuity.

At CTL, we use Zabbix with an operational focus. We analyze the infrastructure, determine what to monitor, set up actionable alerts, and tailor the platform to support the growth of the IT environment. The goal is clear: less uncertainty, fewer incidents, and greater control over operations.

Zabbix_logo

I received a free technical assessment from
your infrastructure

2740 Patagones St., Technology District, Buenos Aires
+54 9 11 4076-2697
Blog

Learn more about Zabbix

Ready to take the
next step?

Complete the form and schedule a personalized meeting with one of our experts.

Loading Form